StatsDirect is used by researchers, students and teachers in medicine, public health and the wider sciences who want sound statistics without learning a programming language first. The data sit in a spreadsheet, the methods are on menus, every result links to its explanation, and each analysis can continue in R or with the built-in tutor. The screens below follow one analysis: a paired t test on the help's own example, peak expiratory flow rate before and after a walk on a cold day in nine asthmatics.
-
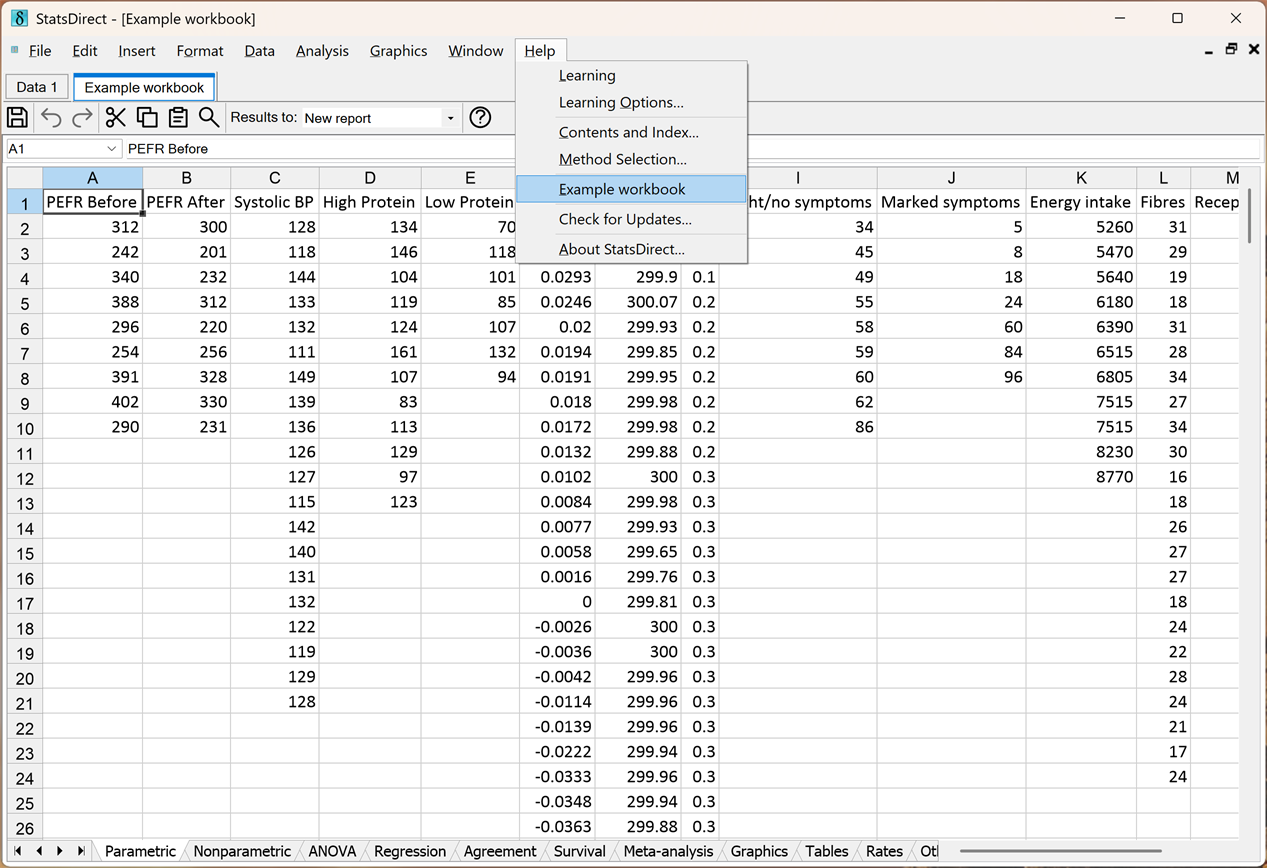 Start with data. Help > Example workbook opens the worked examples from the help, one sheet per family of methods. Your own data open from Excel, text or R files, or you type them in.
-
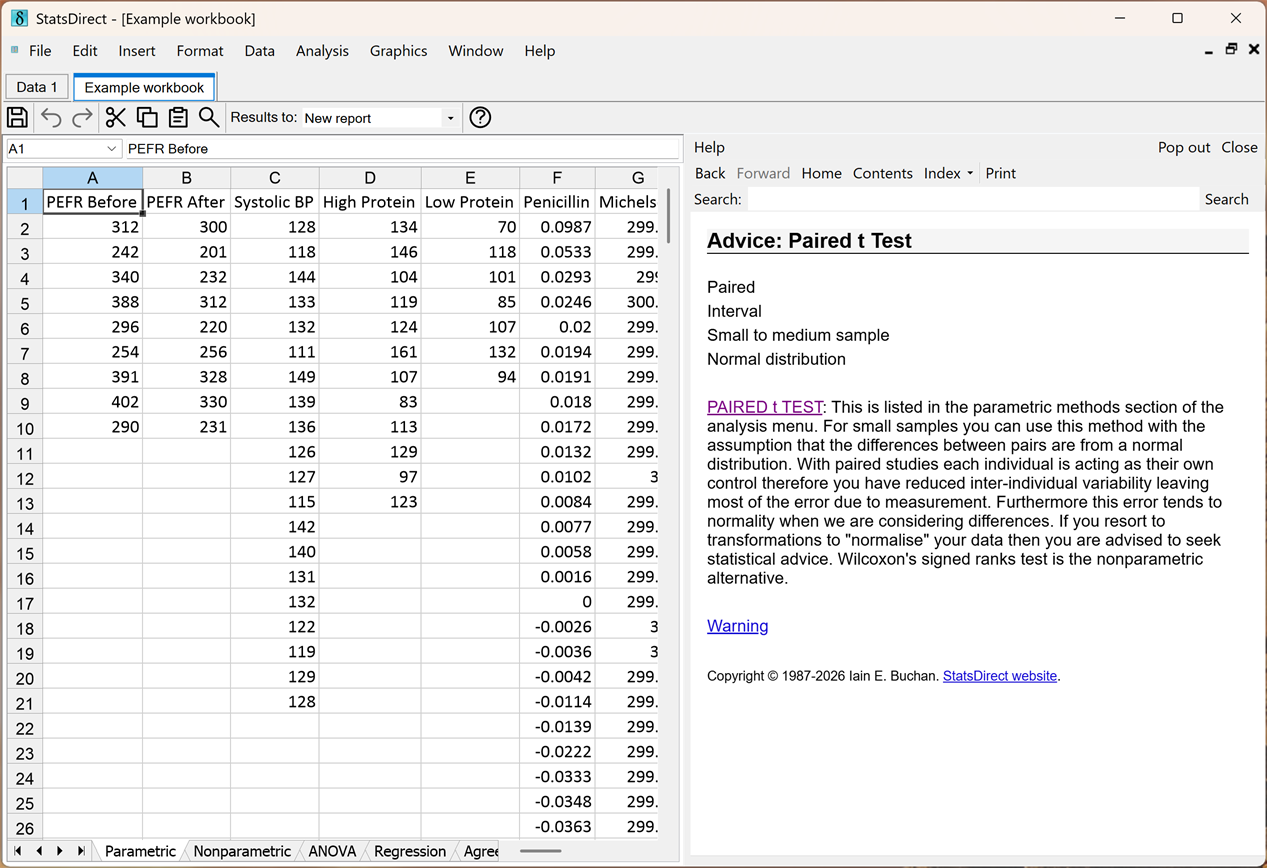 Not sure which test? Help > Method Selection asks what you are comparing and what kind of data you have, and ends at the method with a note on its assumptions. Here that is the paired t test.
-
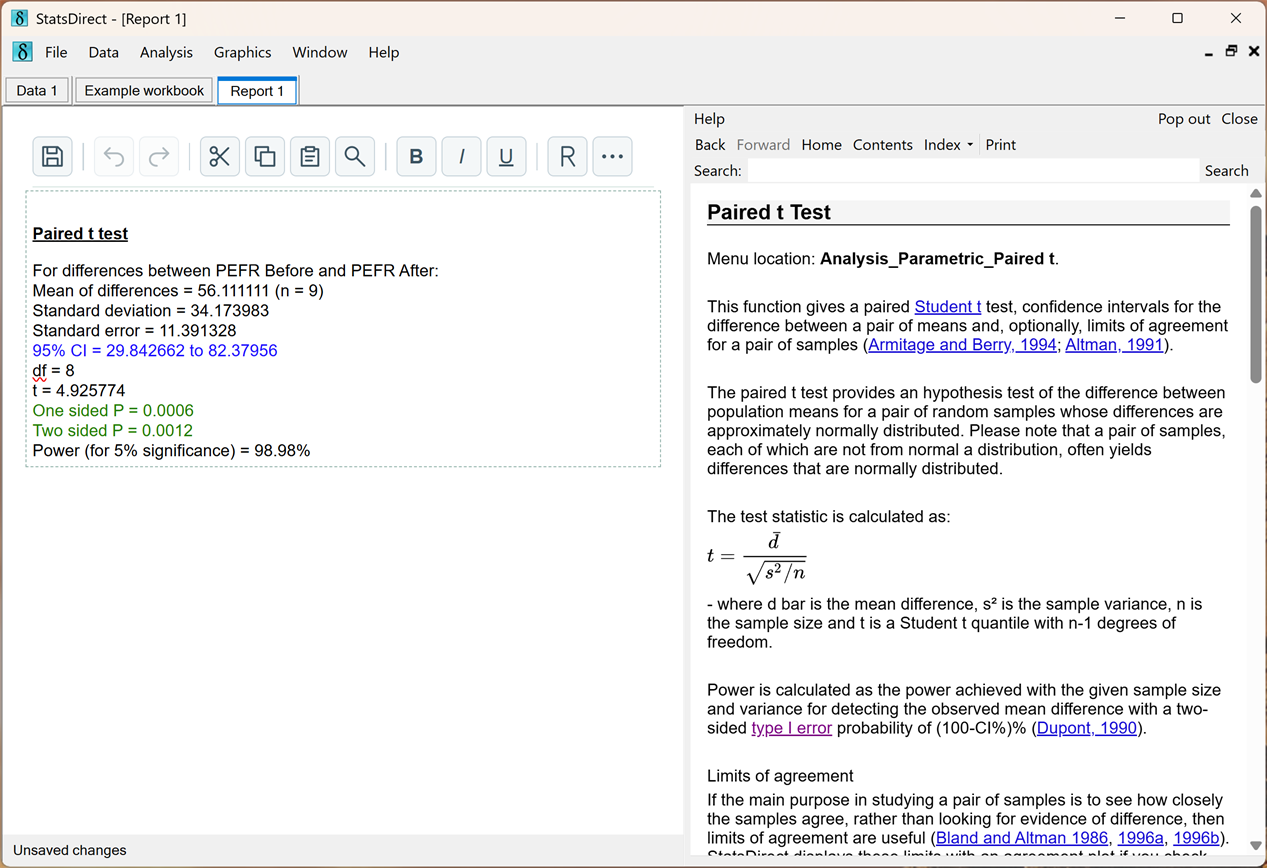 Run the test from the Analysis menu, select the two columns, and the report appears: mean difference, confidence interval, t, P and power. The heading links to the method's help, which opens beside your work.
-
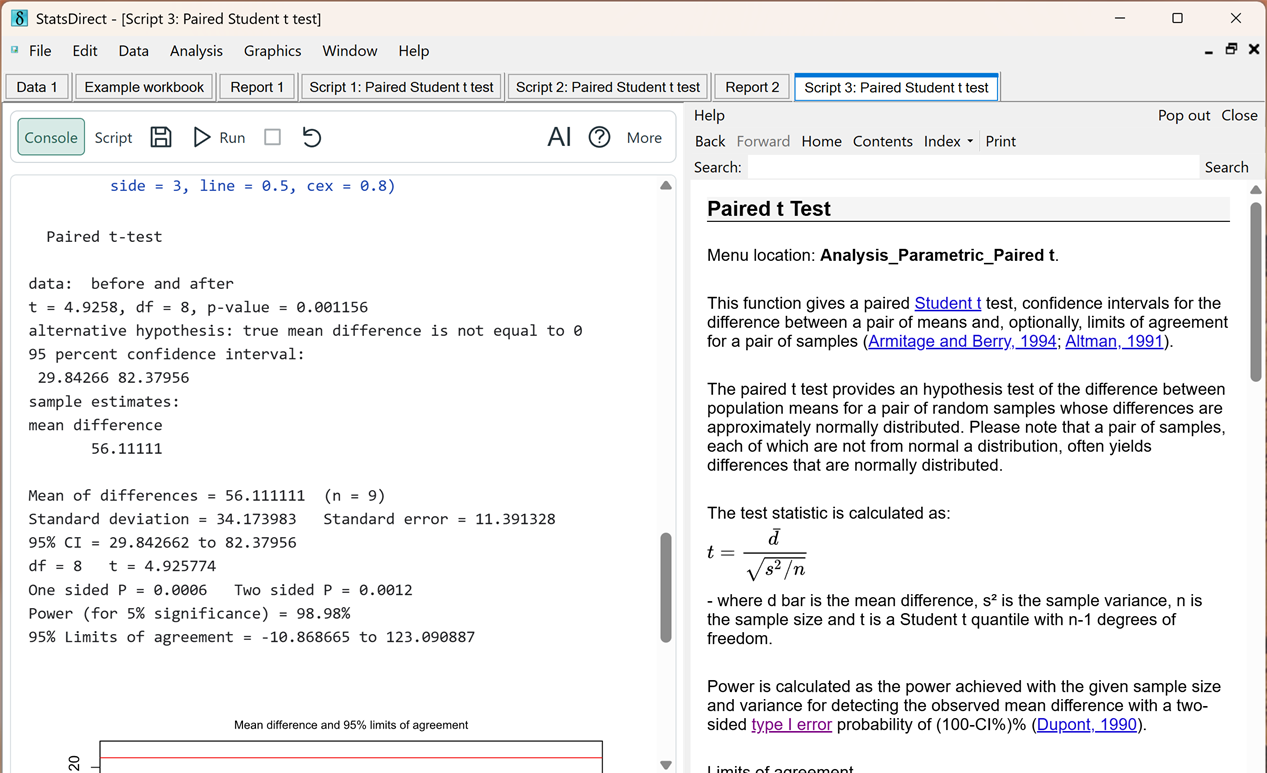 Every analysis has an R script of its data and settings. Continue in R runs it in the built-in console and reproduces the report line for line, with R's own t.test alongside. Take the script to R or RStudio whenever you want.
-
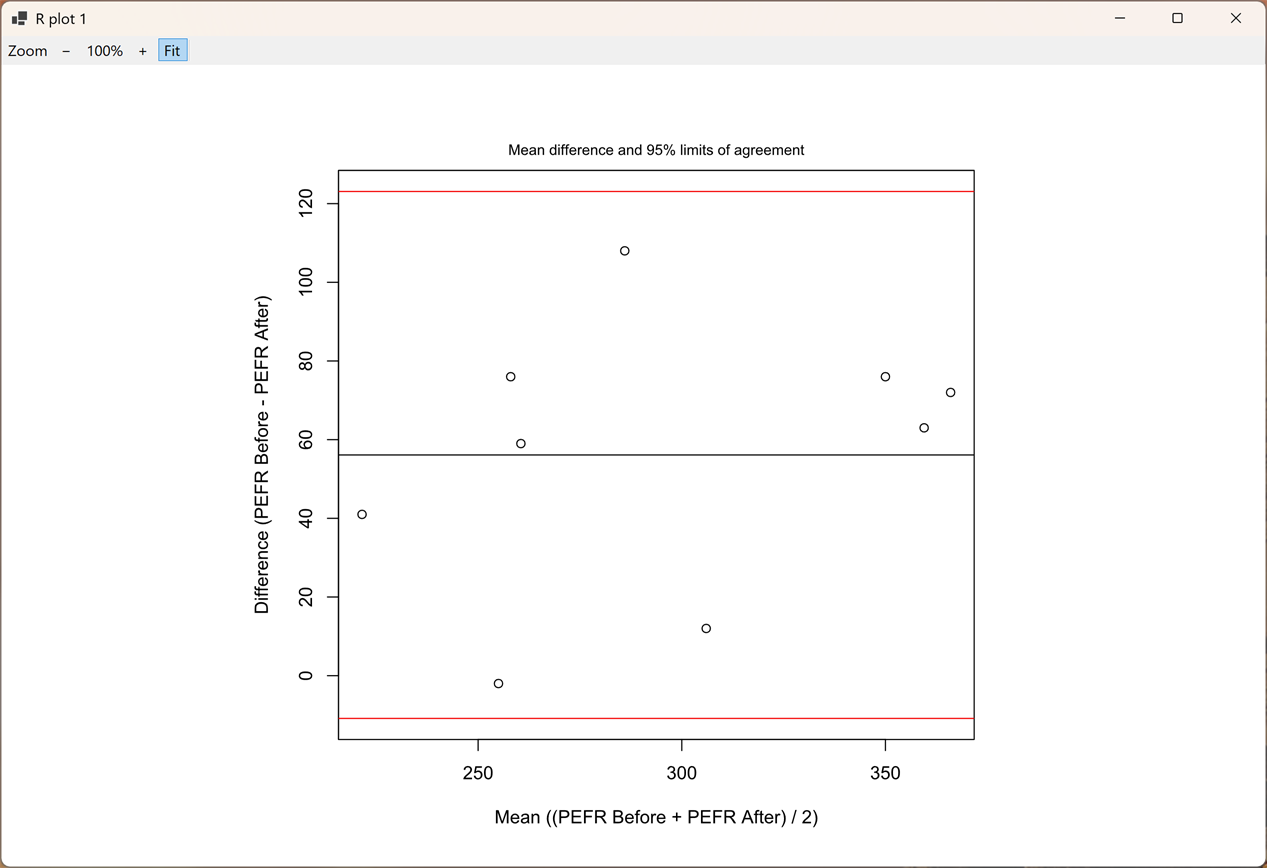 Charts drawn in R open in their own viewer, to zoom, copy or save. This is the Bland and Altman agreement plot the script adds: the mean difference and the 95% limits of agreement.
-
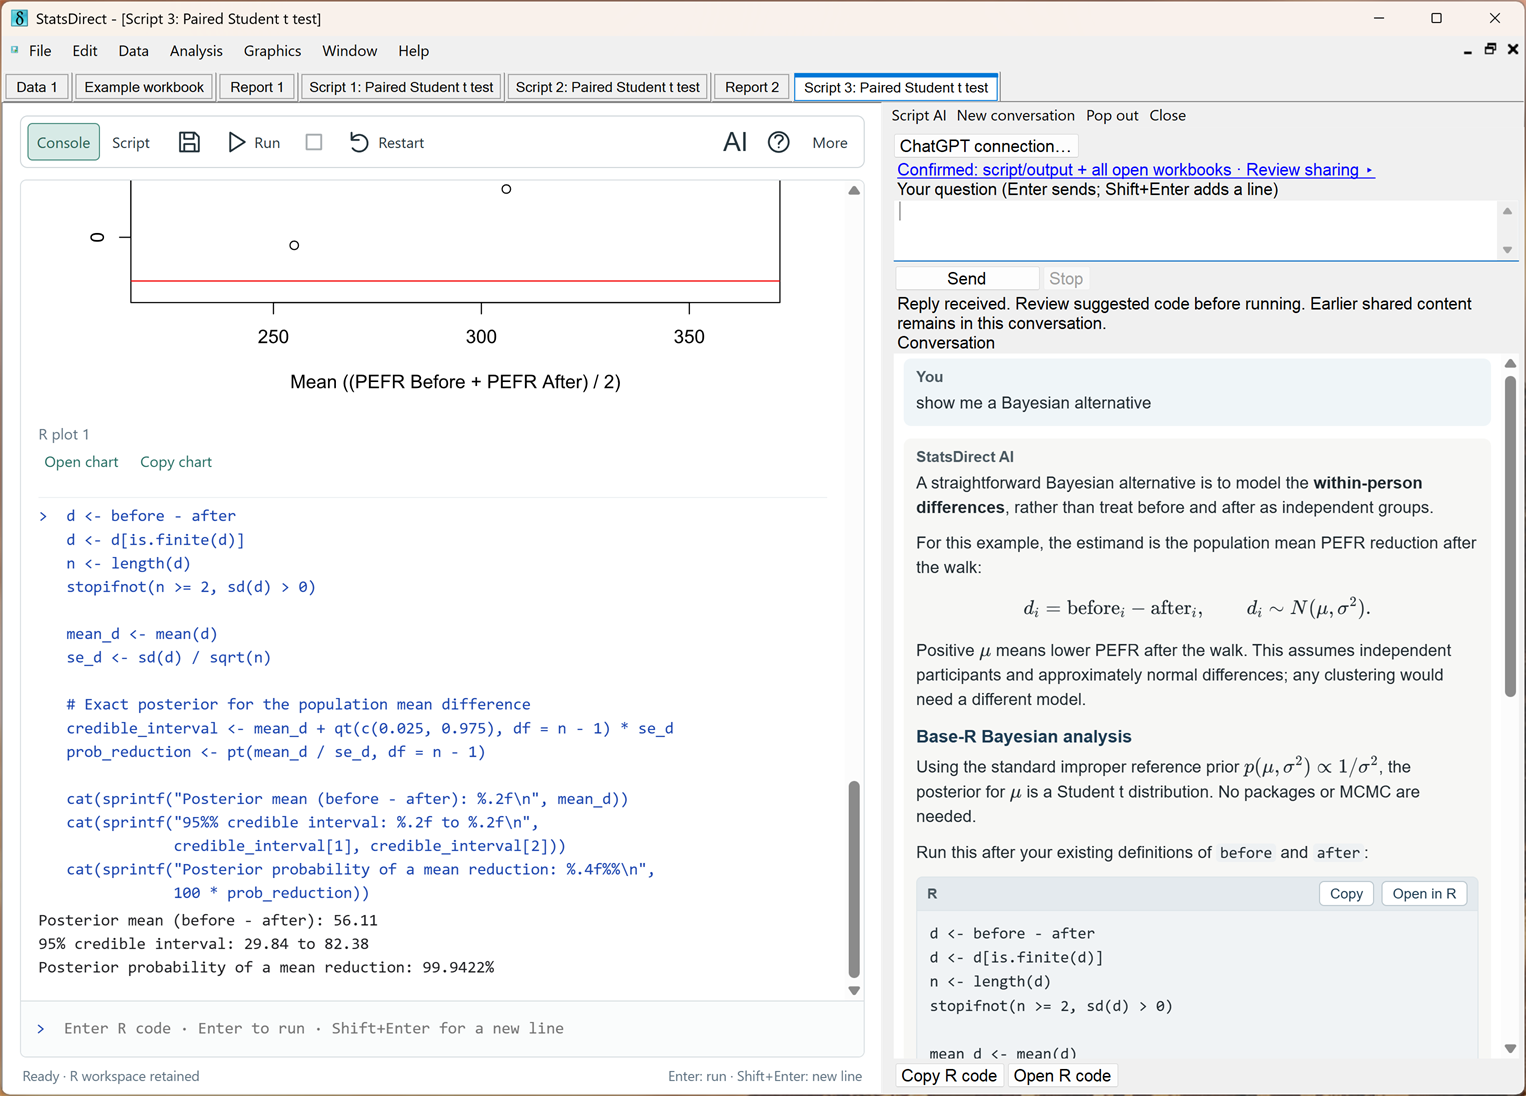 Ask for another view. The Script AI, which uses your own ChatGPT account, writes a Bayesian alternative to the test in R, stating its likelihood and priors, and runs it in the same console.
-
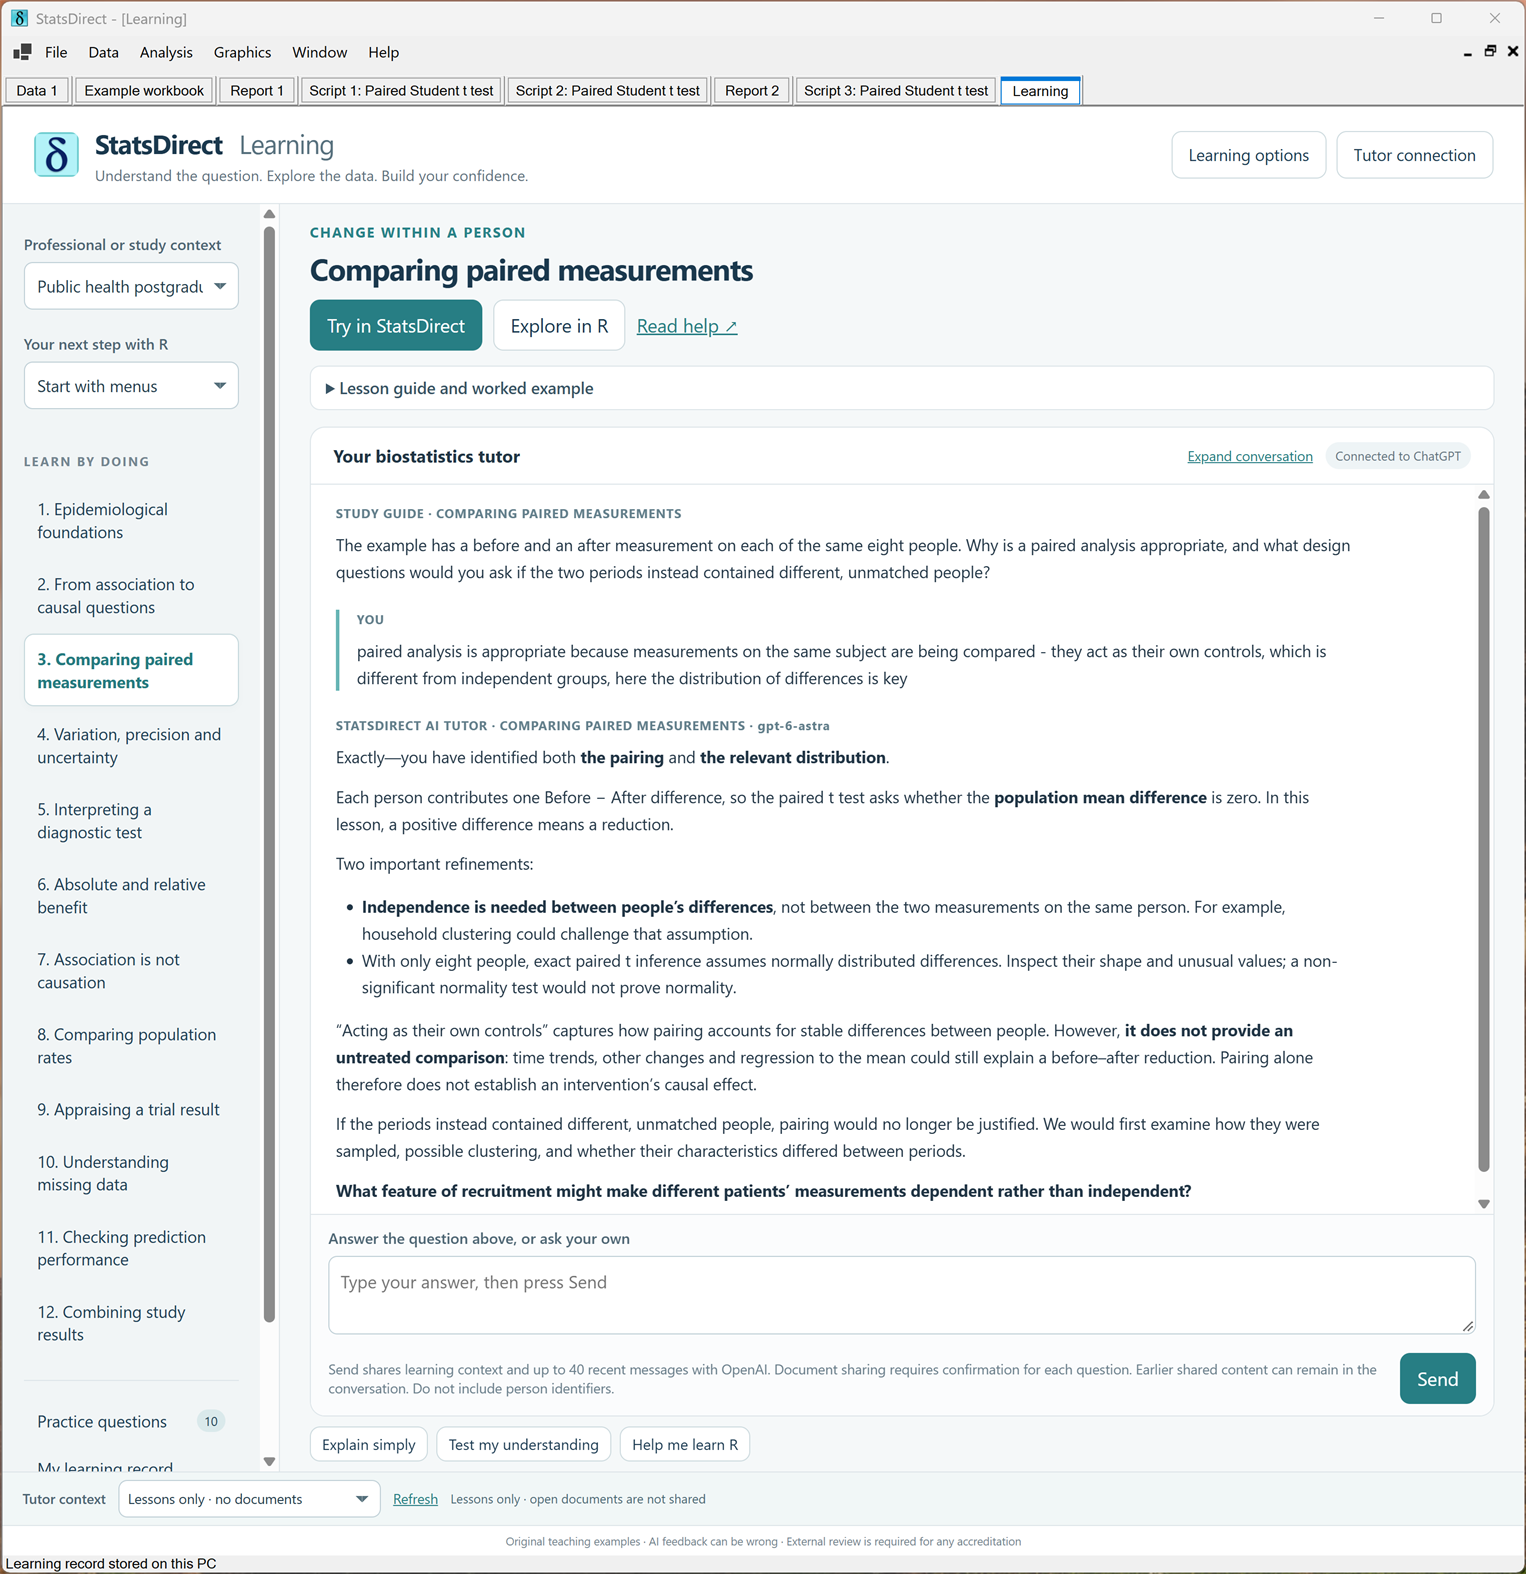 Learn as you go. The tutor under Help > Learning sets questions on the method, takes your answer and explains, drawing on the same help and, when you allow it, on the report you have open.
-
 Share the result. Save the report as an editable HTML page, a Word document or a PDF, or export the whole session as a Jupyter notebook.
Download StatsDirect for Windows or Apple Silicon Macs, free and open source, or read the full specifications.